Private-first endurance explorer

See every route. Understand every effort.

Bring runs, trail runs, rides, and hikes into one spatial history—then connect terrain, sensors, intensity, and fatigue to understand what changed.

Why I built it

Every activity was there. The pattern across them wasn’t.

I built Effort Atlas with my own archive: years, and eventually decades, of activities and the memories attached to them. I wanted to move from a place on the map to every effort that crossed it, compare repeated attempts, and keep terrain, sensors, and long-term patterns connected.

01 · Atlas

Discover everywhere you have been.

Every run, ride, and hike on one map. Filter by activity type, and see where routes repeat and where they deviate — the one time you took a wrong turn and got lost, or the first run in a new city on vacation.

  • Runs, trail runs, rides, and hikes in one atlas
  • Repeated routes, one-off detours, and trips away from home
  • Viewport-aware activity list and aggregate statistics
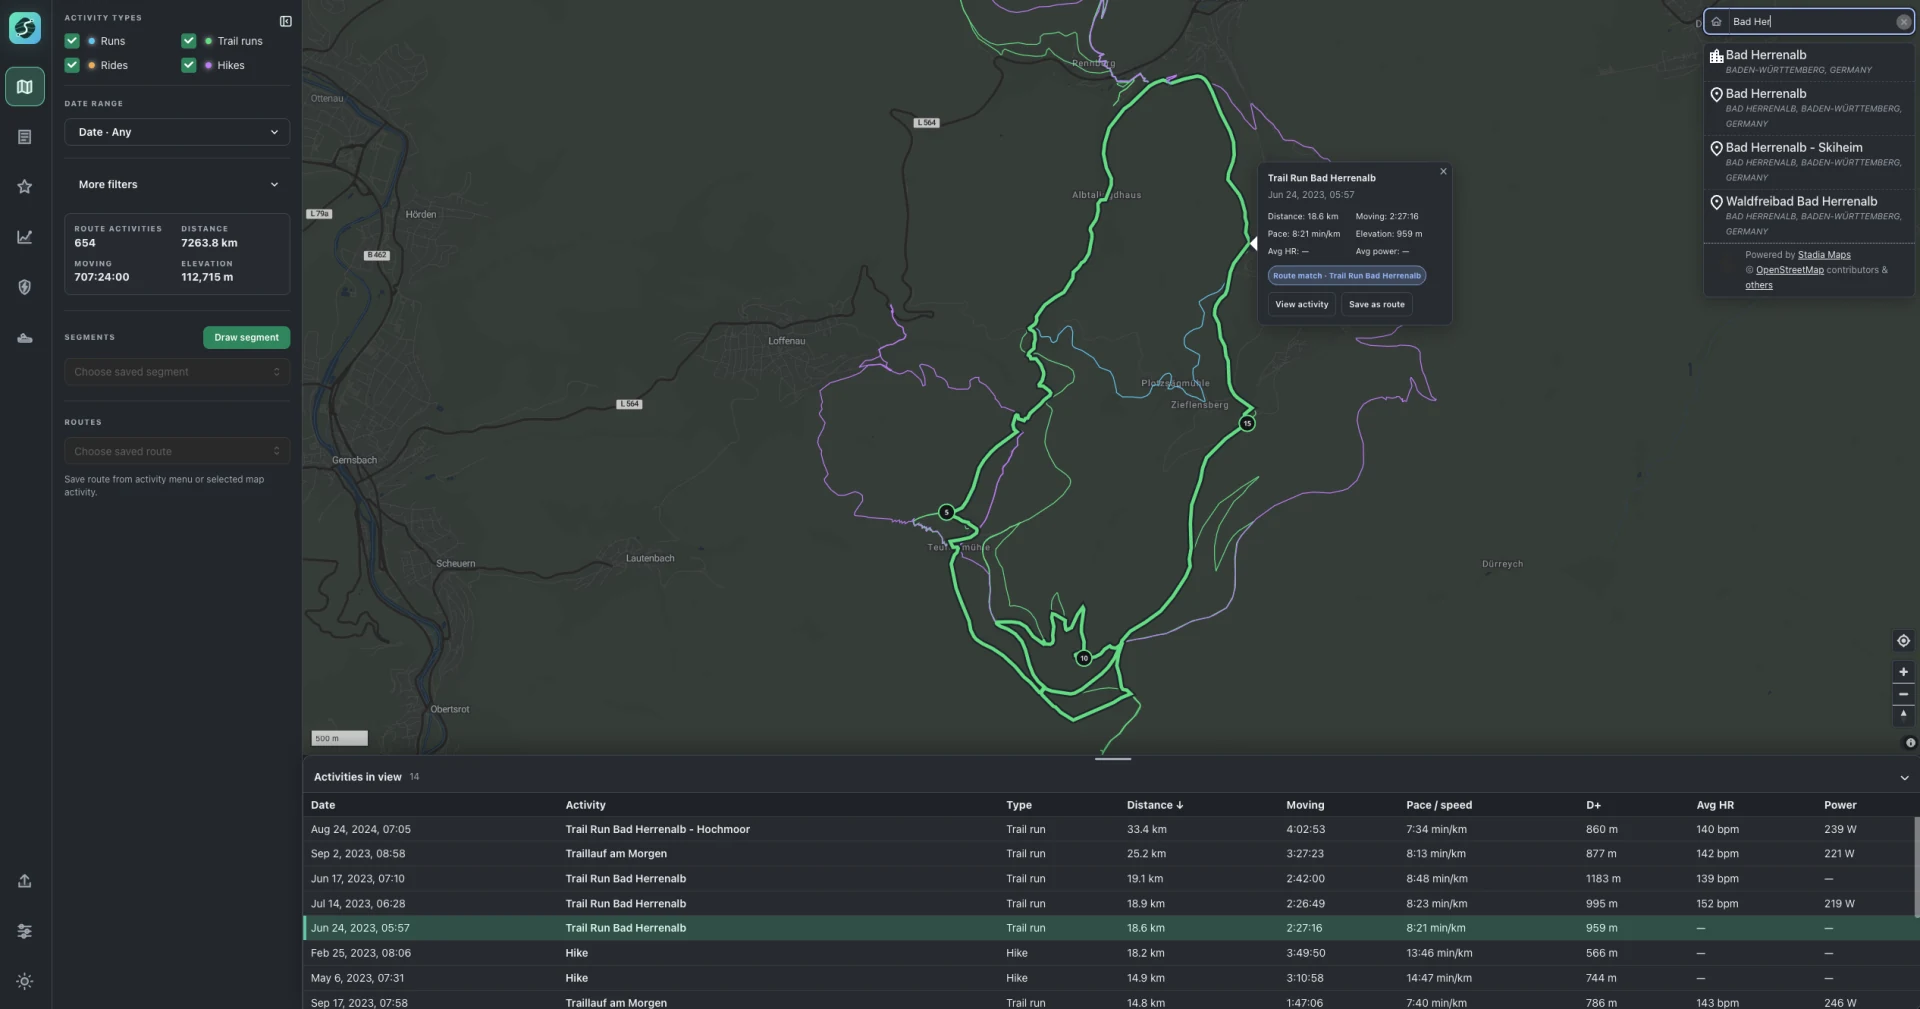
Atlas
Effort Atlas atlas showing activities near Bad Herrenalb, a selected route, and the activity archive

02 · Segments

Define a segment once, and every attempt finds it.

Draw a start and finish gate on the map. Effort Atlas recovers every activity that ever crossed it, and checkpoint gates narrow the match to the exact line you mean.

  • Start and finish gates drawn directly on the map
  • Checkpoints that must be passed in the correct order
  • Matching attempts recomputed as the definition changes
Segment definition · 41 s

03 · Comparison

Compare the same ground by place or by time.

On a matched segment or full route, align by distance to compare heart rate, power, pace, and elapsed time at the same point — such as the same uphill. Align by time to see how far ahead or behind each attempt was, and whether the gap widened or closed before the finish.

  • By distance — compare time and sensor data at the same location
  • By time — compare distance covered at the same elapsed time
  • Synchronized replay with playback speed and follow-leader
  • Sections shaded and ranked by time gained or lost
Segment comparison
Effort Atlas comparison showing matched activity traces, synchronized positions, and time gained or lost along a section

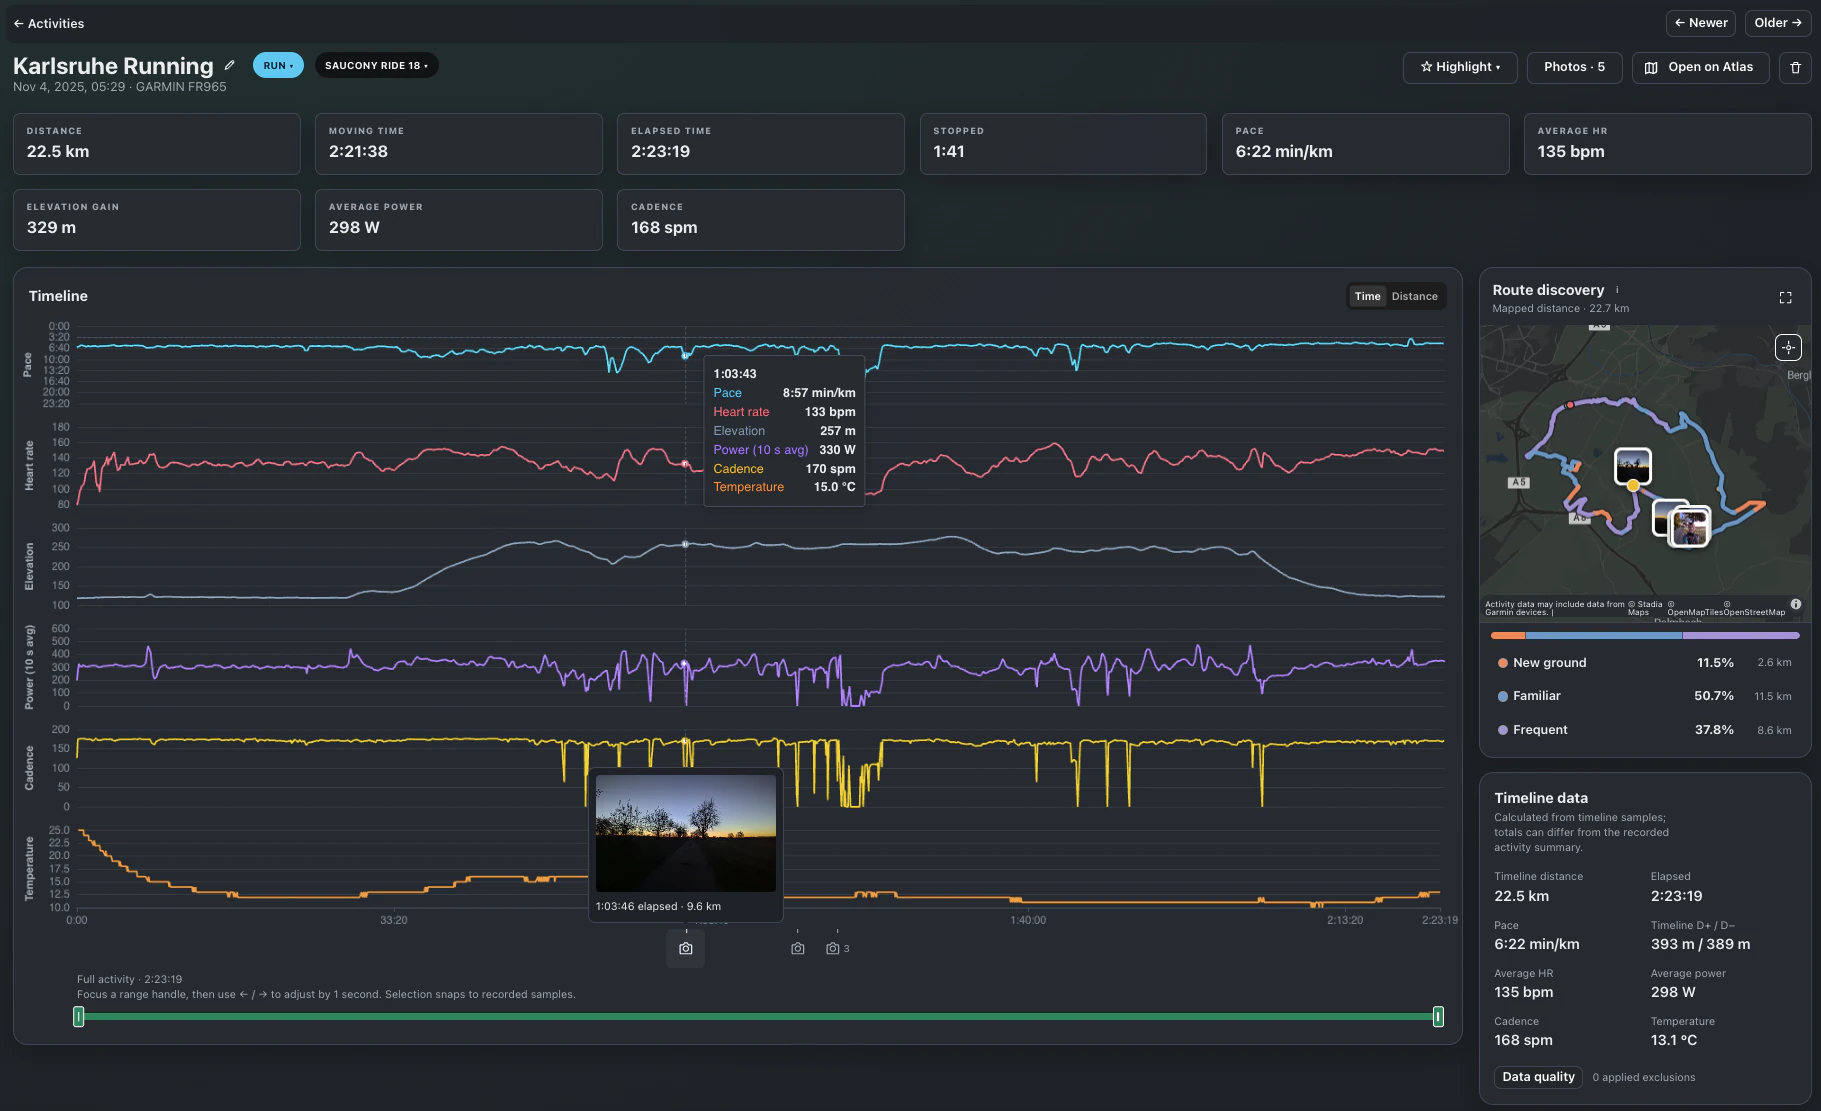
04 · Activity analysis

Know where this effort sits in your history.

Follow an activity end to end through synchronized sensor timelines and photos pinned to where they happened. Save memorable moments as highlights, with the underlying effort and context attached. Effort Atlas identifies the performances that stand out and connects each result to the exact part of the activity behind it. Compare today with recent form, its calendar year, and everything recorded before.

  • Highlights created directly from memorable activity moments
  • Photos synchronized with route position and elapsed time
  • Power-duration and pace-distance performance curves
  • Milestones linked directly to their effort range
  • Heart-rate drift at comparable output
  • Route familiarity, splits, laps, and synchronized sensor timelines
Activity analysis · one effort end to end
Effort Atlas activity analysis showing summary metrics, synchronized sensor timelines, inline activity photos, and a route-discovery map with familiarity breakdown

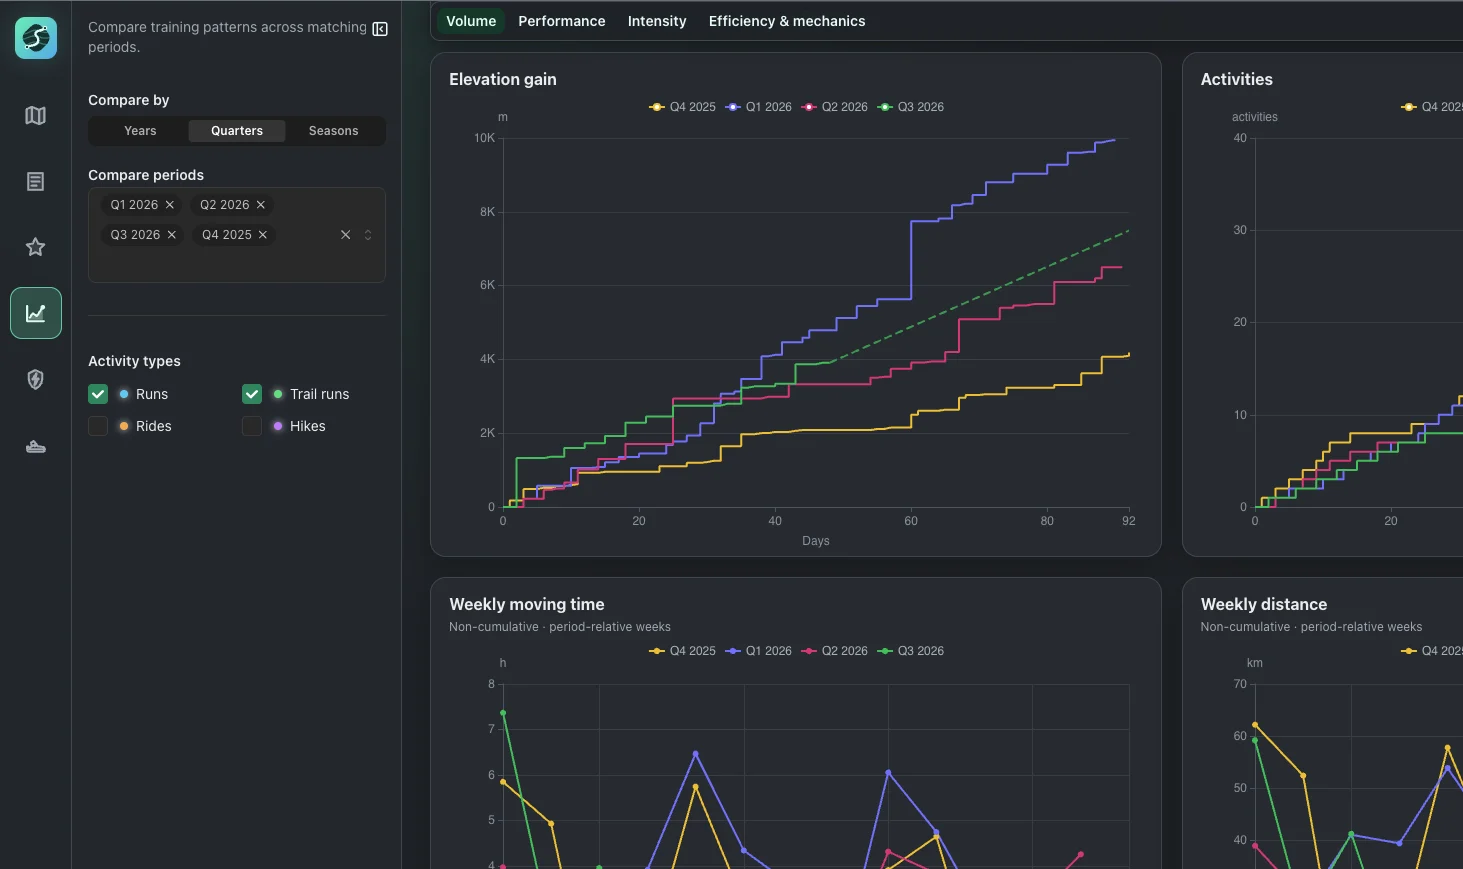
05 · Trends

Compare how your training changed between seasons.

Overlay years, quarters, or custom seasons on the same timeline. Compare volume first, then see whether performance, intensity, efficiency, and mechanics changed with it.

  • Cumulative and week-by-week or month-by-month volume
  • Power-duration and pace-distance curves by period
  • Heart-rate intensity and power-to-heart-rate relationships
  • Cadence at comparable pace or power

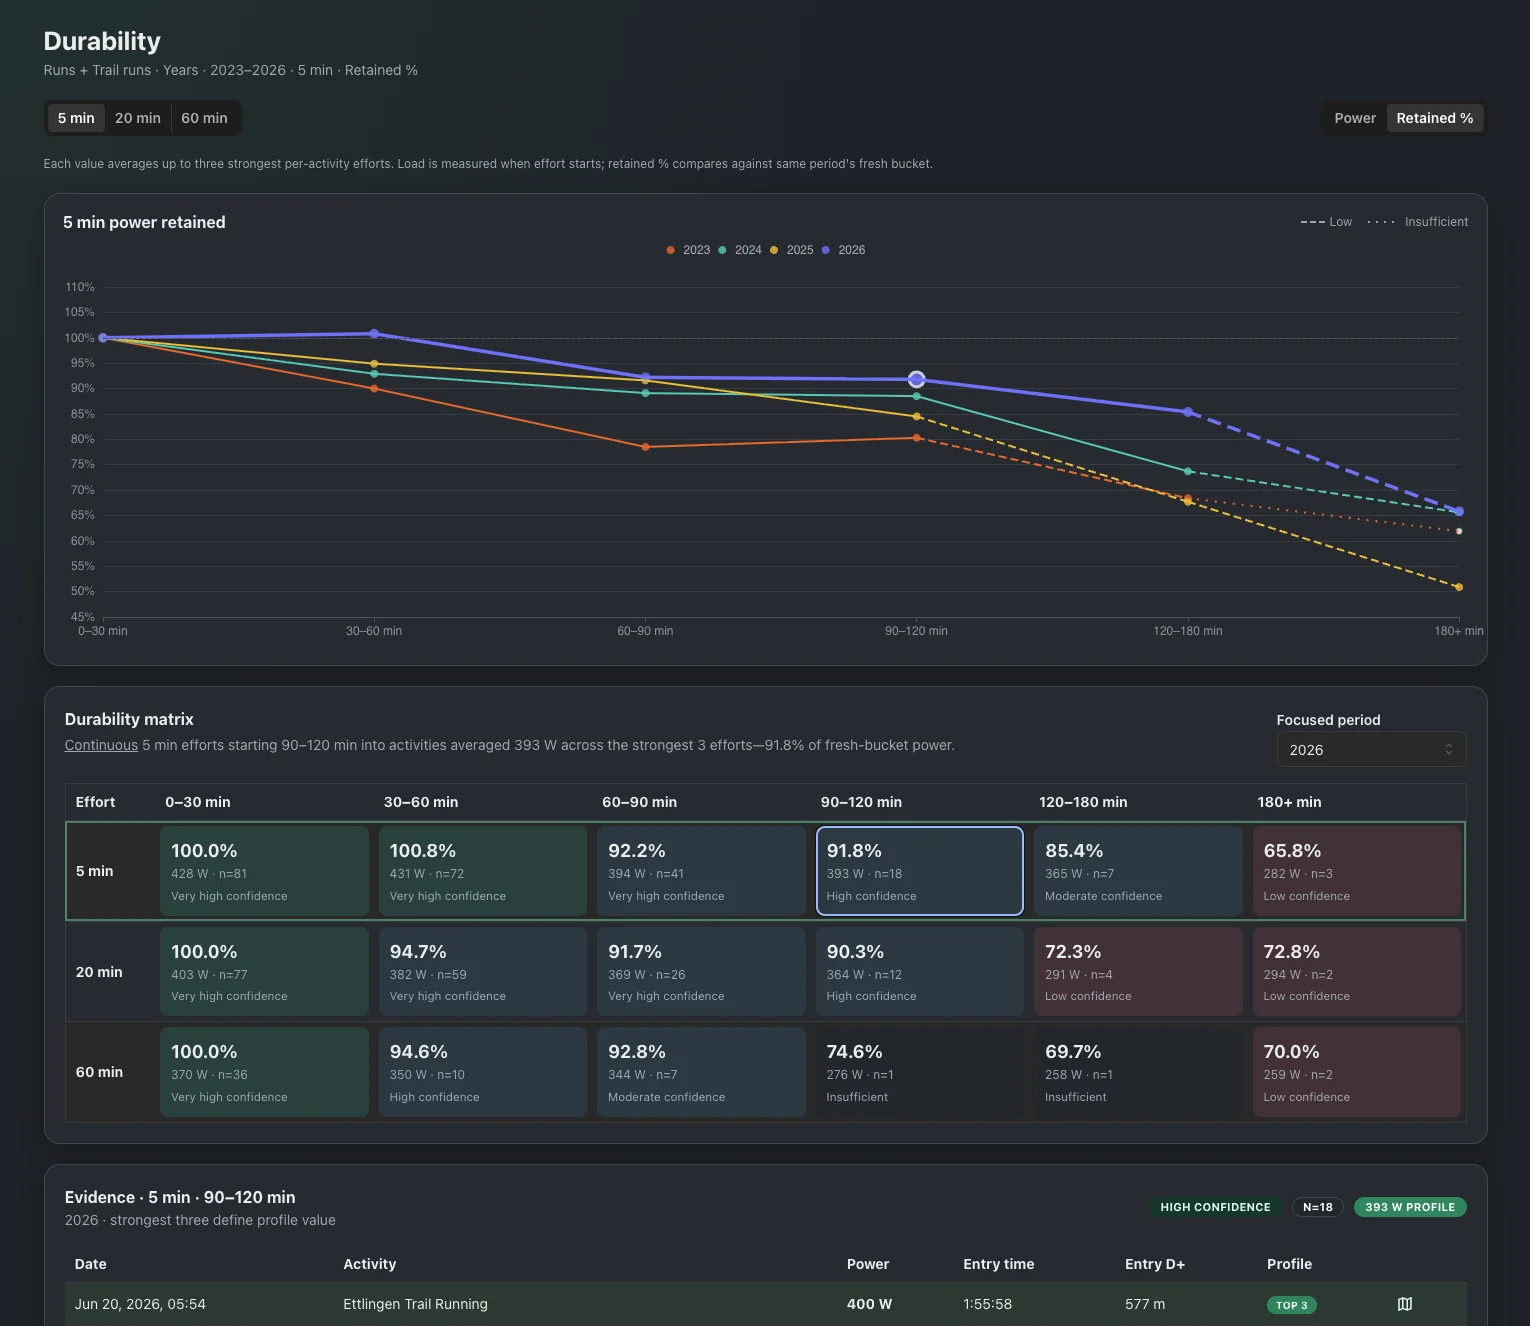
06 · Durability

Measure what remains as fatigue builds.

See how 5-, 20-, and 60-minute power holds up after accumulated moving time or climbing. Compare years or seasons, then open any load bucket to inspect the activities behind it.

  • Fatigue measured by moving time or elevation gain
  • Absolute power or percentage retained from fresh
  • Confidence and sample size for every comparison
  • Contributing activities linked back to their analysis
Durability · retained power, 2023–2026
Effort Atlas durability view showing retained power across accumulated-load buckets for four years, a durability matrix with confidence levels, and the contributing activities

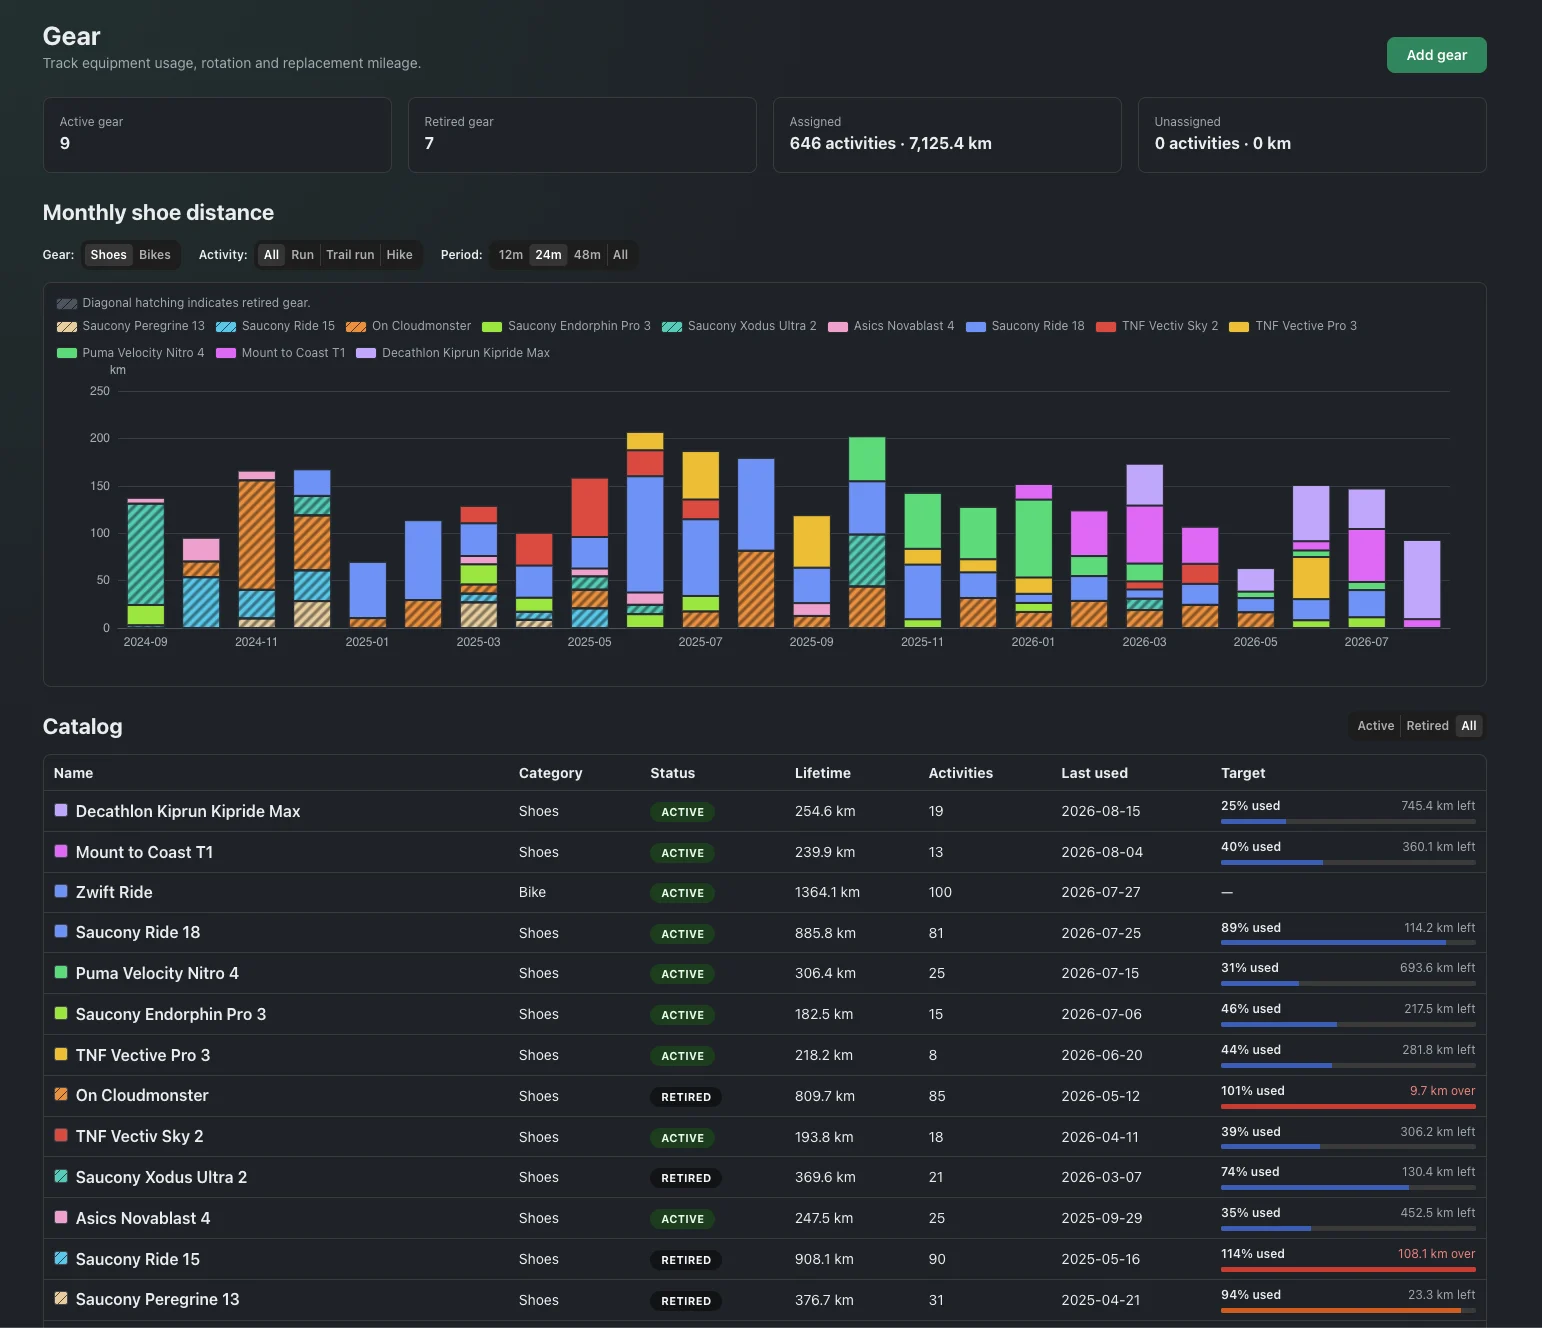
07 · Gear

Track which shoes carried the load — and when.

Turn activity assignments into a complete usage history for every pair of shoes, plus bikes and other equipment. See the rotation month by month, find unassigned activities, and track lifetime distance against replacement targets.

  • Monthly distance by shoe, bike, and activity type
  • Active and retired gear, plus assigned and unassigned activities
  • Lifetime distance, activity count, and last use
  • Replacement targets with remaining or exceeded mileage
Gear · shoe rotation
Effort Atlas gear view showing active and retired equipment, monthly distance per shoe across the rotation, and a catalog with replacement targets

Private beta

Turn a long activity archive into something you can explore.

Requests are reviewed by hand. Tell me what you would want to look at first. Activity views stay behind sign-in, with no ads, public profiles, or leaderboards.